The Bottom Line: Corporate Performance and Gender Diversity in the C-Suite (2004-2008)
Harvey M. Wagner
Principal Investigator
Kenan-Flagler Business School
University of North Carolina at Chapel Hill
Report date: December 15, 2011
Catalyst Inc., the leading nonprofit organization expanding opportunities for women and business, publishes a Business Case research series which reveals that companies achieving gender diversity and managing it well attain better financial results, on average, than other companies. The most recent Catalyst report in this series, The Bottom Line: Corporate Performance and Women’s Representation on Boards (2004-2008), March, 2011, focuses on gender diversity within the Board Room.
The report below, using comparable data, makes the bottom-line business case for gender diversity in the C-Suite (2004-2008). The data and methodology are comparable to that in the Catalyst report cited above.
Acknowledgements
I am grateful to Nancy M. Carter, Senior Vice President, Research, Catalyst Inc., for guidance in pursuing this research, providing corporate diversity data, and suggesting avenues of business-case exploration. The conclusions in the report below may not necessarily reflect those of Catalyst Inc. or its staff.
I also appreciate the assistance provided by the graduate students in the Kenan-Flagler Business School course BUSI 837 (2010) in extracting Compustat information from Wharton Research Data Services.
Gender Diversity in the C-Suite: A Comparison of Economic Results
Strong Financial Performance at Fortune 500 Companies and Women in the C-Suite Align Significantly
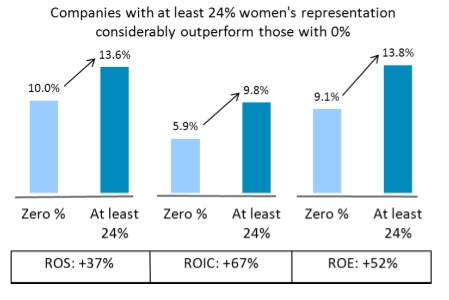
Financial Performance at Companies with at least 24% Women in the C-Suite vs. Those with Zero %
Companies with sustained high representation in the C-Suite (at least 24% women in at least four of the five years) significantly outperform those with sustained low representation (zero % in at least four of five years).
The findings are
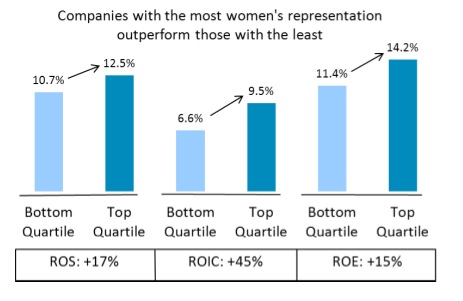
- Companies with the most women in the C-Suite outperform those with the least on ROS by 17%.
- Companies with the most women in the C-Suite outperform those with the least on ROIC by 45%.
- Companies with the most women in the C-Suite outperform those with the least on ROE by 25%.
- Companies with sustained high representation in the C-Suite, defined as those with at least 24% diversity in at least four of five years, significantly outperform those with sustained low representation by 37% on ROS, by 67% on ROIC, and by 52% on ROE.
METHODOLOGY
Research Design
This report uses gender diversity data from Catalyst’s annual Fortune 500 Census of Women Executive Officers and Top Earners report series for the years 2005– 2009. Corresponding financial data for the companies examined were obtained from the Standard & Poor’s Compustat database for the years 2004–2008. [1]
The performance measures return on sales (ROS), return on invested capital (ROIC), and return on equity (ROE) for each company are averages across the study time span. Likewise, the gender diversity measures for each company are averages across the study time span. Only companies with at least three years of financial measures as well as at least two years of gender diversity data are included in this report’s analyses. Because of movement into and out of the Fortune 500 list each year, there were a total of 524 companies in this study.
A few companies exhibit extreme values for the average financial performance measures. In addition, overall averages of financial performance measures differ among this study’s 20 Standard & Poor’s Global Industry Classification Standard (GICS) groups (which have a four-digit designation). First, these extreme values were Winsorized for each of the 20 GICS groups, and then the resulting average performance measures were standardized (mean 0, standard deviation 1) within each of the 20 GICS groups. Lastly, the standardized measures for all companies were reverse standardized to reflect the actual averages of the financial measures across all companies in the time span.
Analyses
Quartile Analysis
This study constructed two portfolios based on women’s representation in the C-Suite drawn from the 524 companies. The top-quartile portfolio contains the 131 companies that have the highest average percentage of women in the C-Suite, while the bottom-quartile portfolio contains the 131 companies with the lowest average percentage of women in the C-Suite.
For companies in the top-quartile portfolio, the average percentage for women’s representation ranges from 20 percent to 50 percent, with an overall average of 26 percent. For companies in the bottom-quartile portfolio, the average percentage for women’s representation ranges from zero percent to 8 percent, with an overall average of 3 percent.
To establish whether an empirical link exists between gender diversity in leadership and a financial performance measure, this report first calculated the difference between the means of this measure for the top- and bottom-quartile portfolios. Then a two-sample, one-tail t-test using unequal variances was applied to assess the statistical significance of each difference in the means.
The difference in means for the top- and bottom-quartile portfolios was significant for ROS at p=.06, for ROIC at p=.06, and for ROE at p=.01.
Sustained Representation Analysis
This report also examined whether the strength of the empirical link is more pronounced when there is a sustained commitment or lack of commitment to gender diversity across time. Companies were selected for analysis that, for at least four years across 2005–2009, had zero percent (low-commitment portfolio) and at least 24% (high-commitment portfolio). The value 24% separates the 131 companies in the top-quartile portfolio into two groups that have the smallest ratio of sum of squared errors within the groups to the squared difference between the means of the groups.
The high-commitment portfolio (at least 24%) included 40 companies with an average across the time span that ranged from 20% to 50% and an overall average 32%. The low-commitment portfolio (zero percent) included 30 companies with an average across the time span that ranged from 0.00% to 0.03% and an overall average 0.01%.
To ascertain the strength of the link for sustained gender diversity and a financial performance measure, this report first calculated the difference between the means of this measure for the high- and low-commitment portfolios. Then a two-sample, one-tail t-test using unequal variances was applied to assess the statistical significance of each difference in the means.
The difference in means for the high- and low-commitment portfolios was significant for ROS at p=.05, for ROIC at p=.05, and for ROE at p=.10.
Definitions
Fortune 500: Fortune magazine’s ranking of the top 500 U.S. incorporated companies filing financial statements with the government is based on each company’s gross annual revenue. Included in the list are public companies, private companies, and cooperatives that file a 10-K with the SEC, and mutual insurance companies that file with state regulators. [2]
Return on Sales (ROS): The pre-tax net profit divided by revenue.
Return on Invested Capital (ROIC): The ratio of after-tax net operating profit to invested capital.
Return on Equity (ROE): The ratio of after-tax net profit to stockholders’ equity.
Notes
[1] Catalyst’s annual Fortune 500 Census report series reflects the publication year of the performance for the prior year. Due to this publication timing, the span 2005–2009 for the Fortune 500 and Catalyst’s Census data corresponds to the span 2004–2008 for the Standard & Poor’s Compustat database financial performance data.
[2] Fortune magazine, Fortune 500
© 2011 Harvey M. Wagner


For further information consult Catalyst